Views: 192
Given its position as the world’s premier cryptocurrency and its sheer market capitalization, Bitcoin (BTC) has always served, to an extent, as the microcosm of the broader crypto market.
At the very start of June 2024, this does not only still appear true but also looks as though it has expanded as BTC is, at the time of publication, apparently poised both for a deeper crash and a significant surge after a period of relative stagnation and sideways trading.
Indeed, such a sense of a simultaneous boom and bust can be seen across different assets, with the overall economy in a paradoxical state in which fears of a crash are running rampant while most forecasts are remaining very bullish.
When it comes to Bitcoin, at least, technical analysis may finally be able to see past the obstacles and help investors discern what the world’s premier cryptocurrency will do next.
Bitcoin set for a significant surge
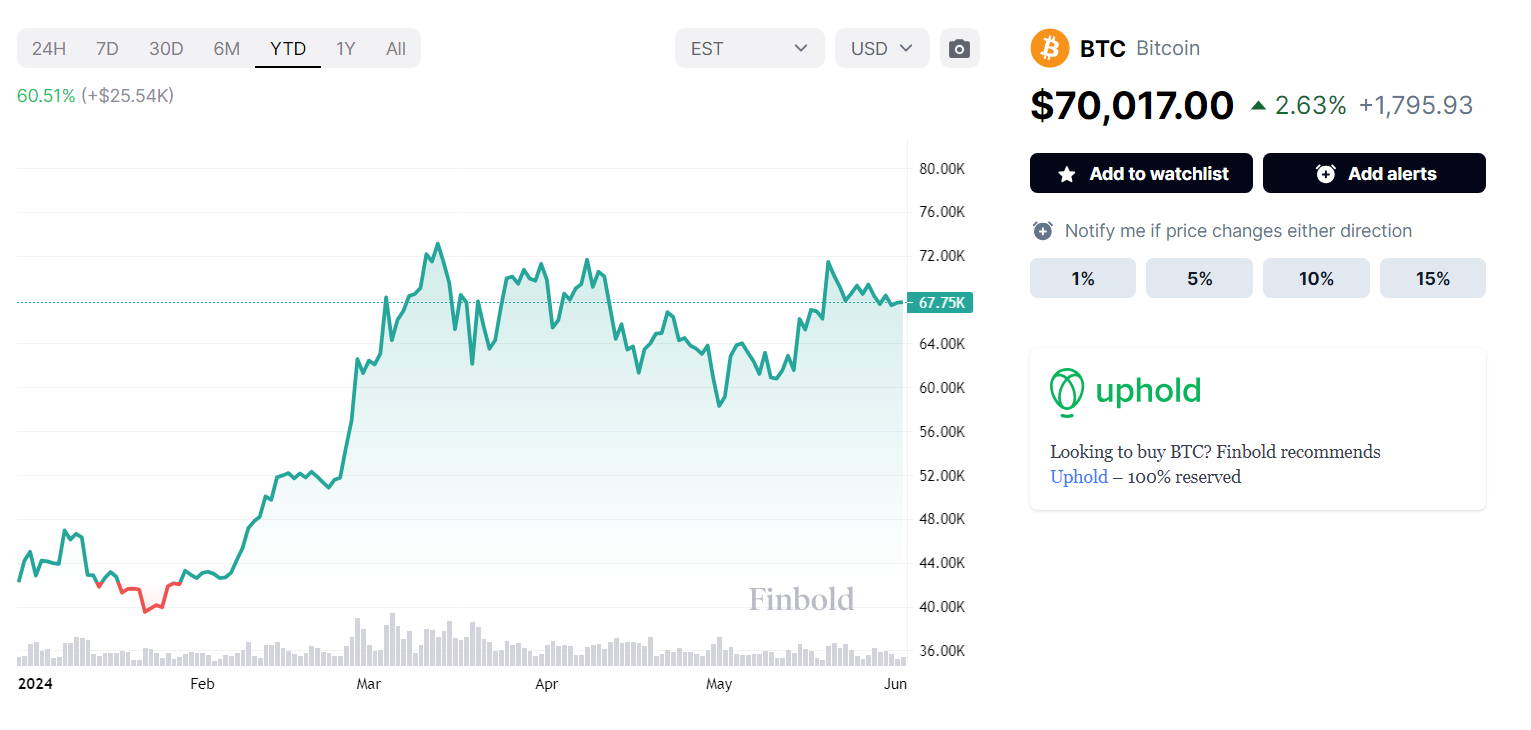
Following a sharp rise in the first months of 2024, Bitcoin entered a period of protracted sideways trading – albeit marked by substantial volatility and swings in the range between approximately $59,000 and about $71,000.
Indeed, while BTC is 60.51% in the green year-to-date, it rose a mere 9.41% in the last 30 days and 0.41% in the last 7. Additionally, Bitcoin price today stands at $70,017, though the day’s trading has already featured substantial volatility.
On June 3, however, BTC appears set to break out of a symmetrical triangle chart pattern it has formed, per the analysis conducted by the prominent crypto expert on X, Ali Martinez.
According to Martinez, should Bitcoin sustain a price above $69,330, it is likely the coin will shoot up as high as $74,400.
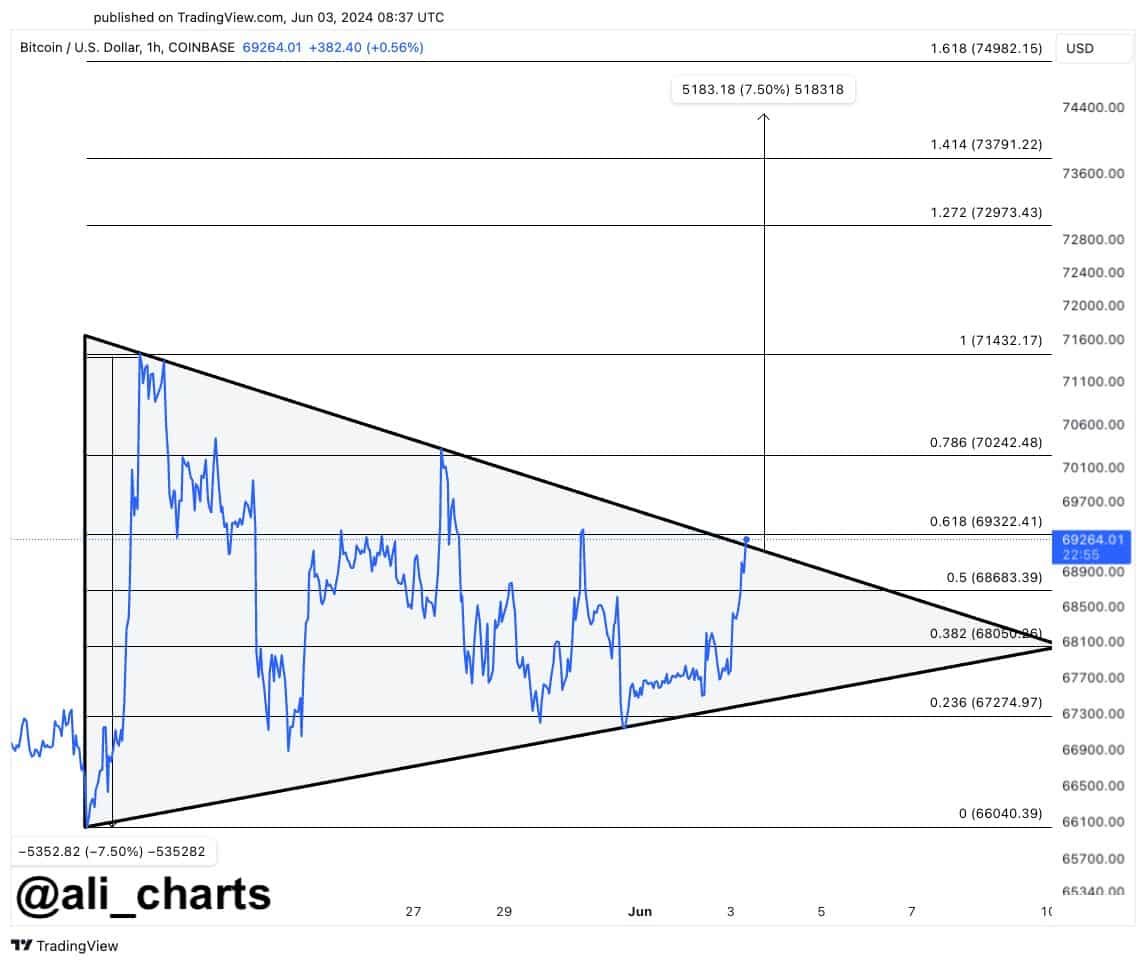
Highlighting the uncertainty of the broader market, however, the hints at an imminent breakout stemming from the symmetrical triangle come at the same time as a strong signal issued by a technical indicator called TD Sequential.
Indeed, this indicator – made to estimate whether the current trend is set to be confirmed or reversed based on historical price movements – demonstrates that Bitcoin is, in fact, set to enter a correction toward either $68,700 or $68,050, again per Ali Martinez’s analysis.
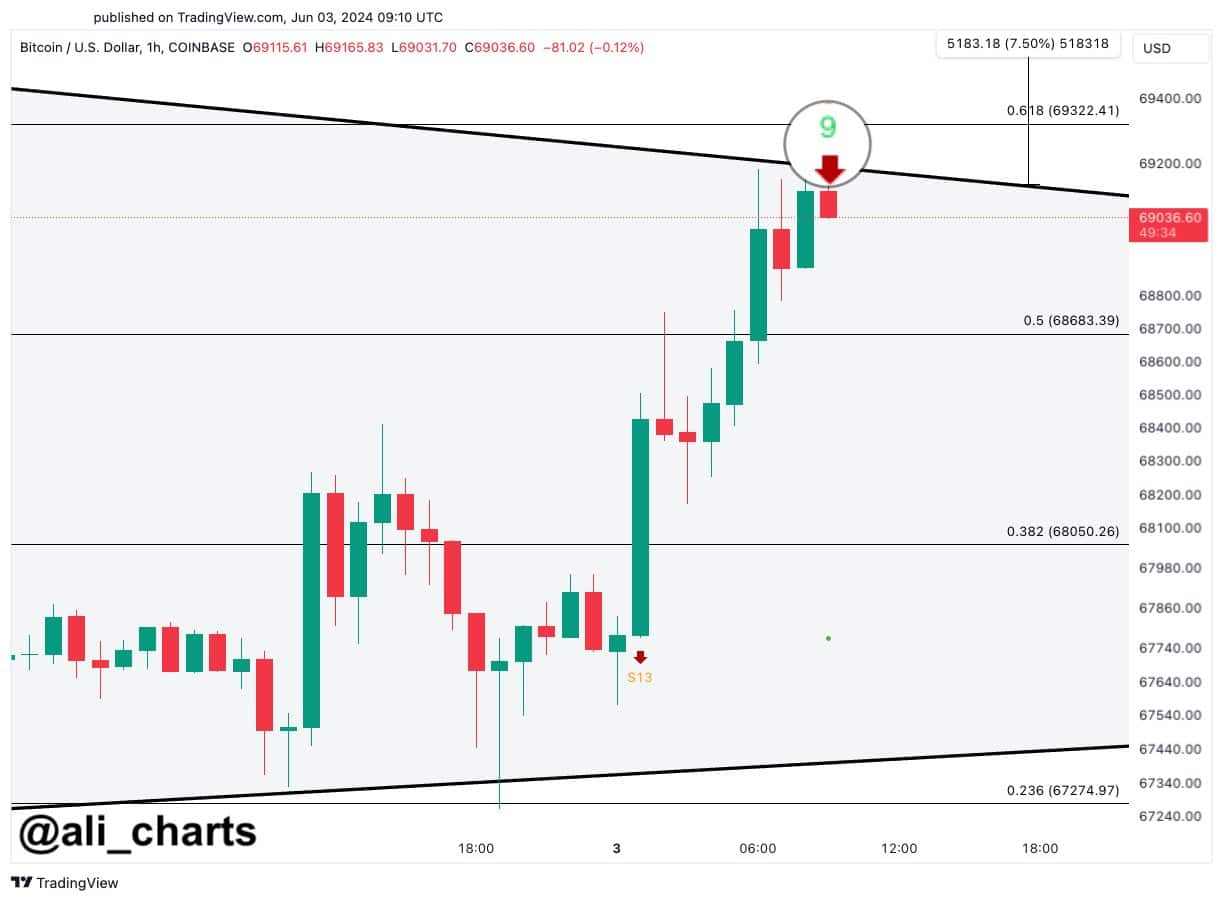
The crypto expert, however, pointed out that despite the sell signal issued by TD Sequential, it remains likely that should Bitcoin remain consistently above the crucial resistance level at $69,300, a bullish breakout remains likely for BTC.
Disclaimer: The content on this site should not be considered investment advice. Investing is speculative. When investing, your capital is at risk.